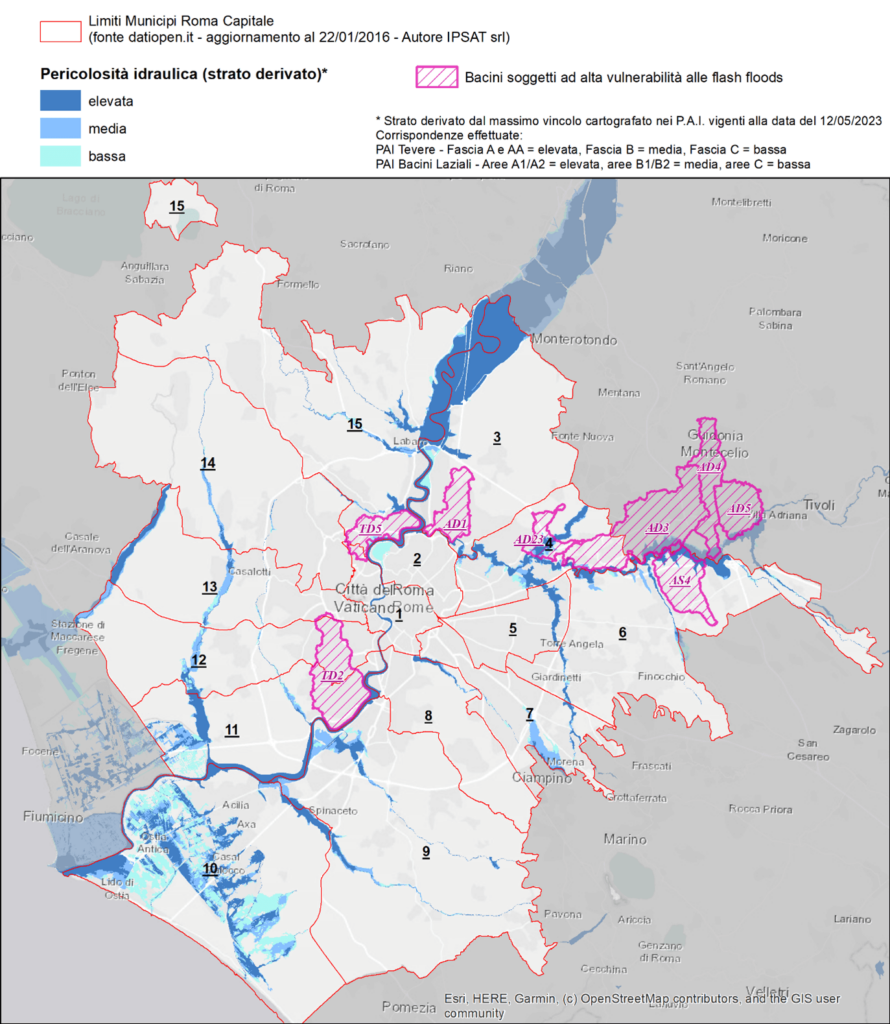
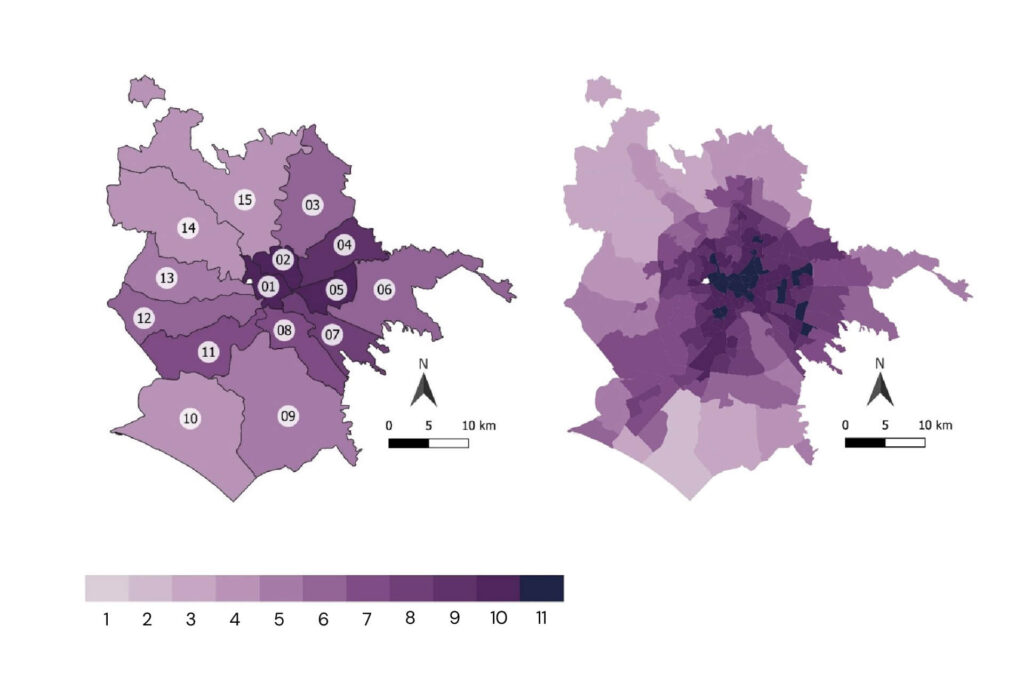
The territory of Rome has seen significant changes in temperature and precipitation in recent years. The meteoclimatic data show an upward trend in temperature between 1971 and 2021, with the highest values recorded in the last decade. According to Istat in Rome heat increase is more pronounced than all other Italian regional capitals: The average temperature for the period 2011-2021 marks higher values over Rome (17.7°C), averaging +1.7°C over the period 1981-2010, respectively. In particular, there are on the rise the number of summer days (i.e., those with a maximum temperature greater than 25 degrees) and of tropical nights (with temperatures not falling below 20 degrees), and, in parallel, the number of days with frost has decreased.
With respect to precipitation, however, there is evidence of increased variability and changes in rainfall regimes, with rainy years alternating with low rainfall years, the lengthening of rainfall-free days and, at the same time, the intensity of rainfall on some days. The total annual precipitation averaged 807 millimeters during 1971-2000, then decreased to 783 during 2011-2021. An analysis of days with very heavy precipitation highlights how rainfall is increasingly concentrated on very rainy days, with negative management consequences of the phenomena.
There are four priorities regarding impacts in the Rome area:
The impact of rainfall
The increased intensity and frequency of heavy rainfall and flooding, with consequences for infrastructure and urban spaces due to the significant hydrogeological risk situations present. According to the Central Apennine Basin District Authority, nearly 400 thousand people live in areas at hydrogeological risk: about 145 thousand people in areas subject to direct flooding of watercourses and about 245 thousand in areas affected by potential flash floods.

The impact on water supply security.
In a perspective of longer drought periods, attention to the water resource becomes strategic, it is necessary to reduce losses (in Rome 27.8% against a national average of 41) and to rethink the management model to drastically reduce the consumption of source water, as well as withdrawals from wells, through innovative water-saving choices in domestic, agricultural, and industrial uses and the replacement with water from rainwater storage and purification plants, therefore clean and usable for all compatible uses as required by European Directives.
The impact of heat on the urban area
The rise in temperatures and heat waves, in a city where the heat has already risen and with neighborhoods where there is a worrying urban heat island effect. Epidemiological analyses (study of the distribution of health and disease of populations) highlight increased mortality and hospitalizations as a consequence of periods of heat waves, with a greater and synergistic effect when associated with peaks in air pollution. Integrated analysis of environmental and social vulnerability for low socioeconomic status shows that 9 percent of Rome’s resident population lives in neighborhoods at risk during periods of prolonged heat waves.

The impact on the coastal littoral
In recent years, the impacts of storm surges and tornadoes, beach erosion processes in Rome’s approximately 20 kilometers of coastline have increased. In a sea level rise perspective, simulation models of shoreline changes clearly indicate the areas at greatest risk, because at a lower elevation than sea level, and those where salt wedge upwelling processes could intensify.


