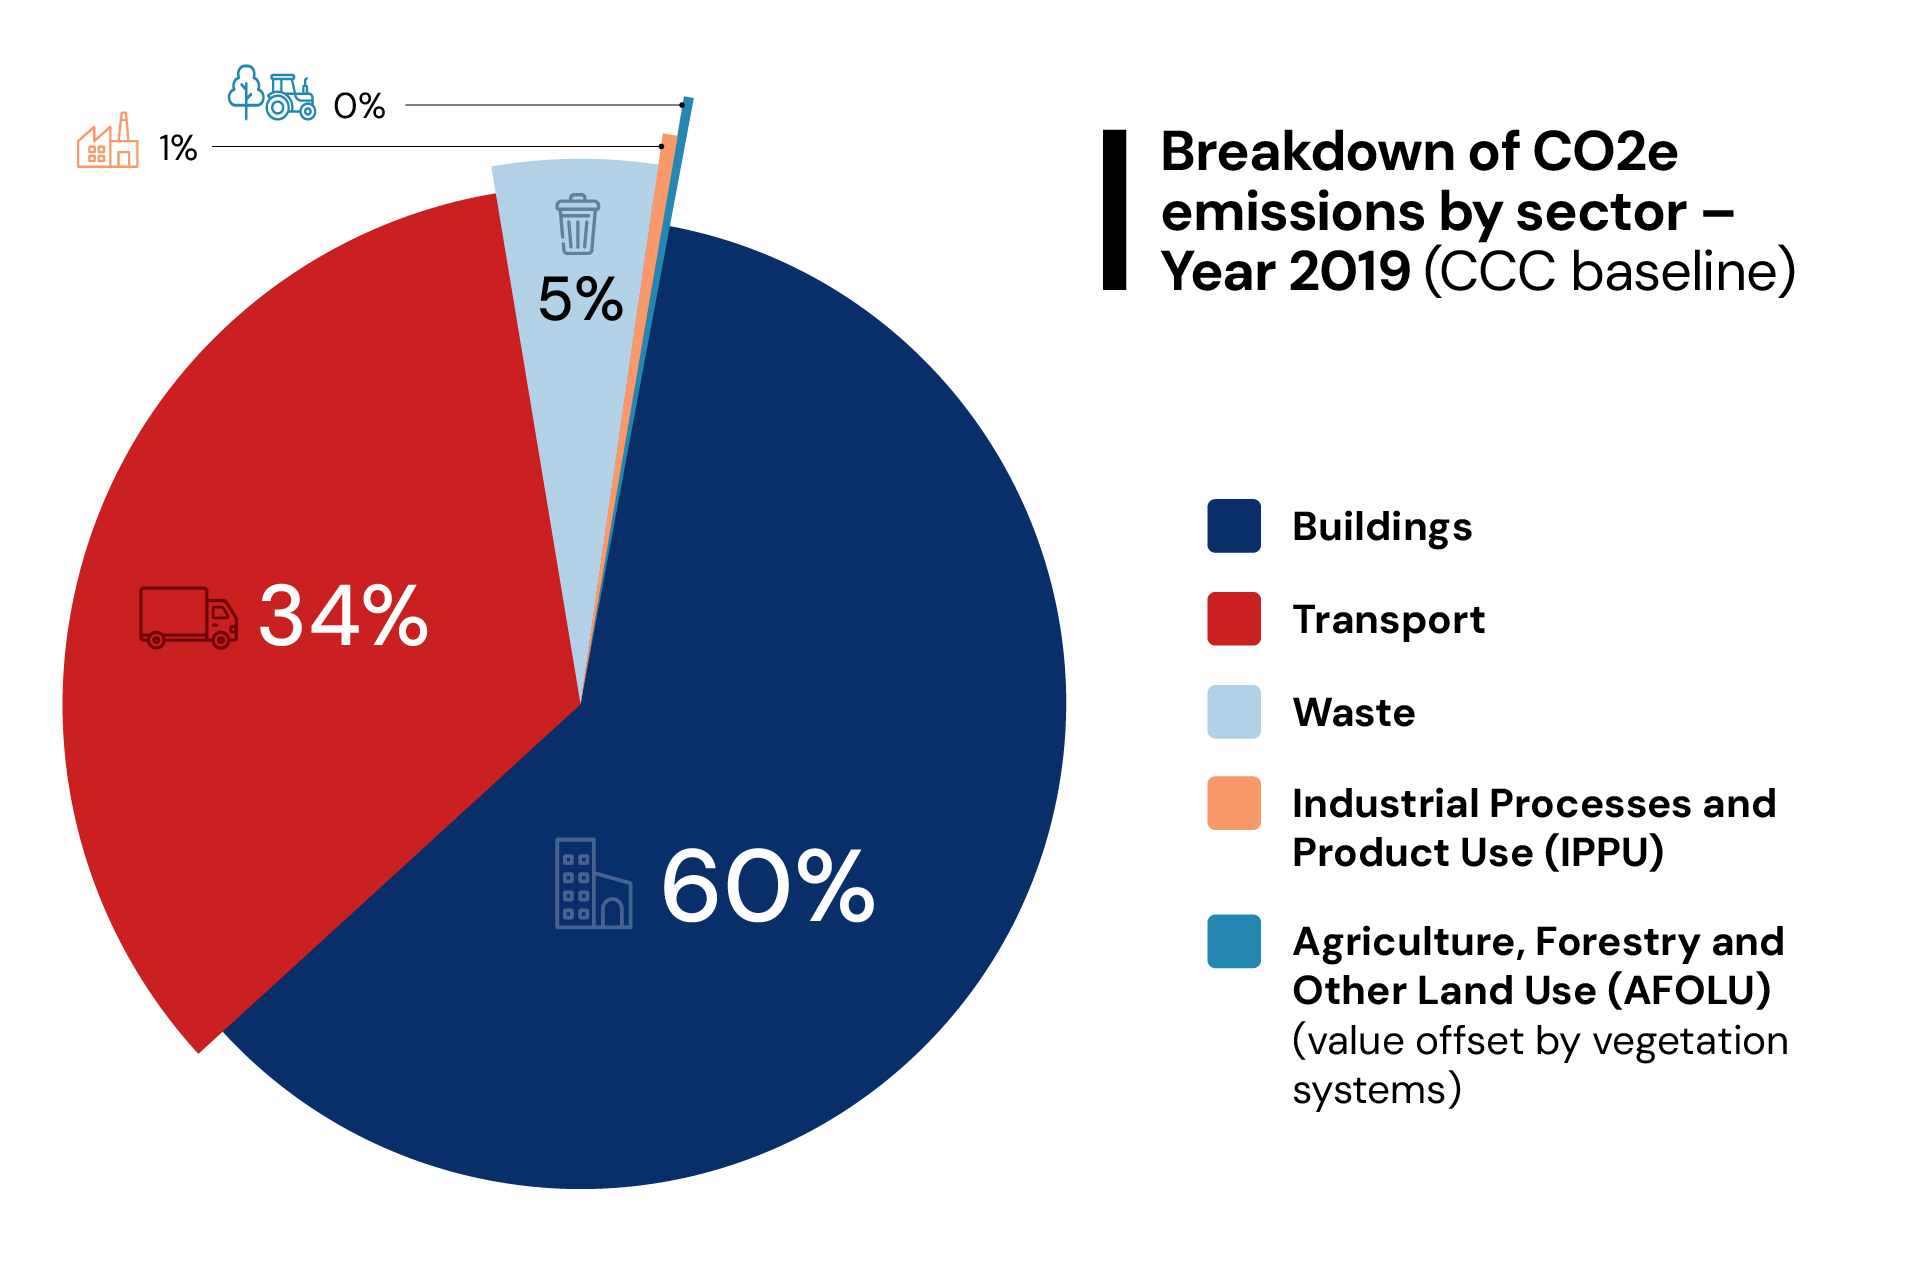


In Rome, the emissions of CO2 come mainly from electrical and thermal consumption of buildings (for 59.6 percent) and gasoline and diesel consumption of motor vehicles(33.7 percent). More limited are the emissions that come from waste (5 percent), industrial processes (IPPU) and agriculture (AFOLU).
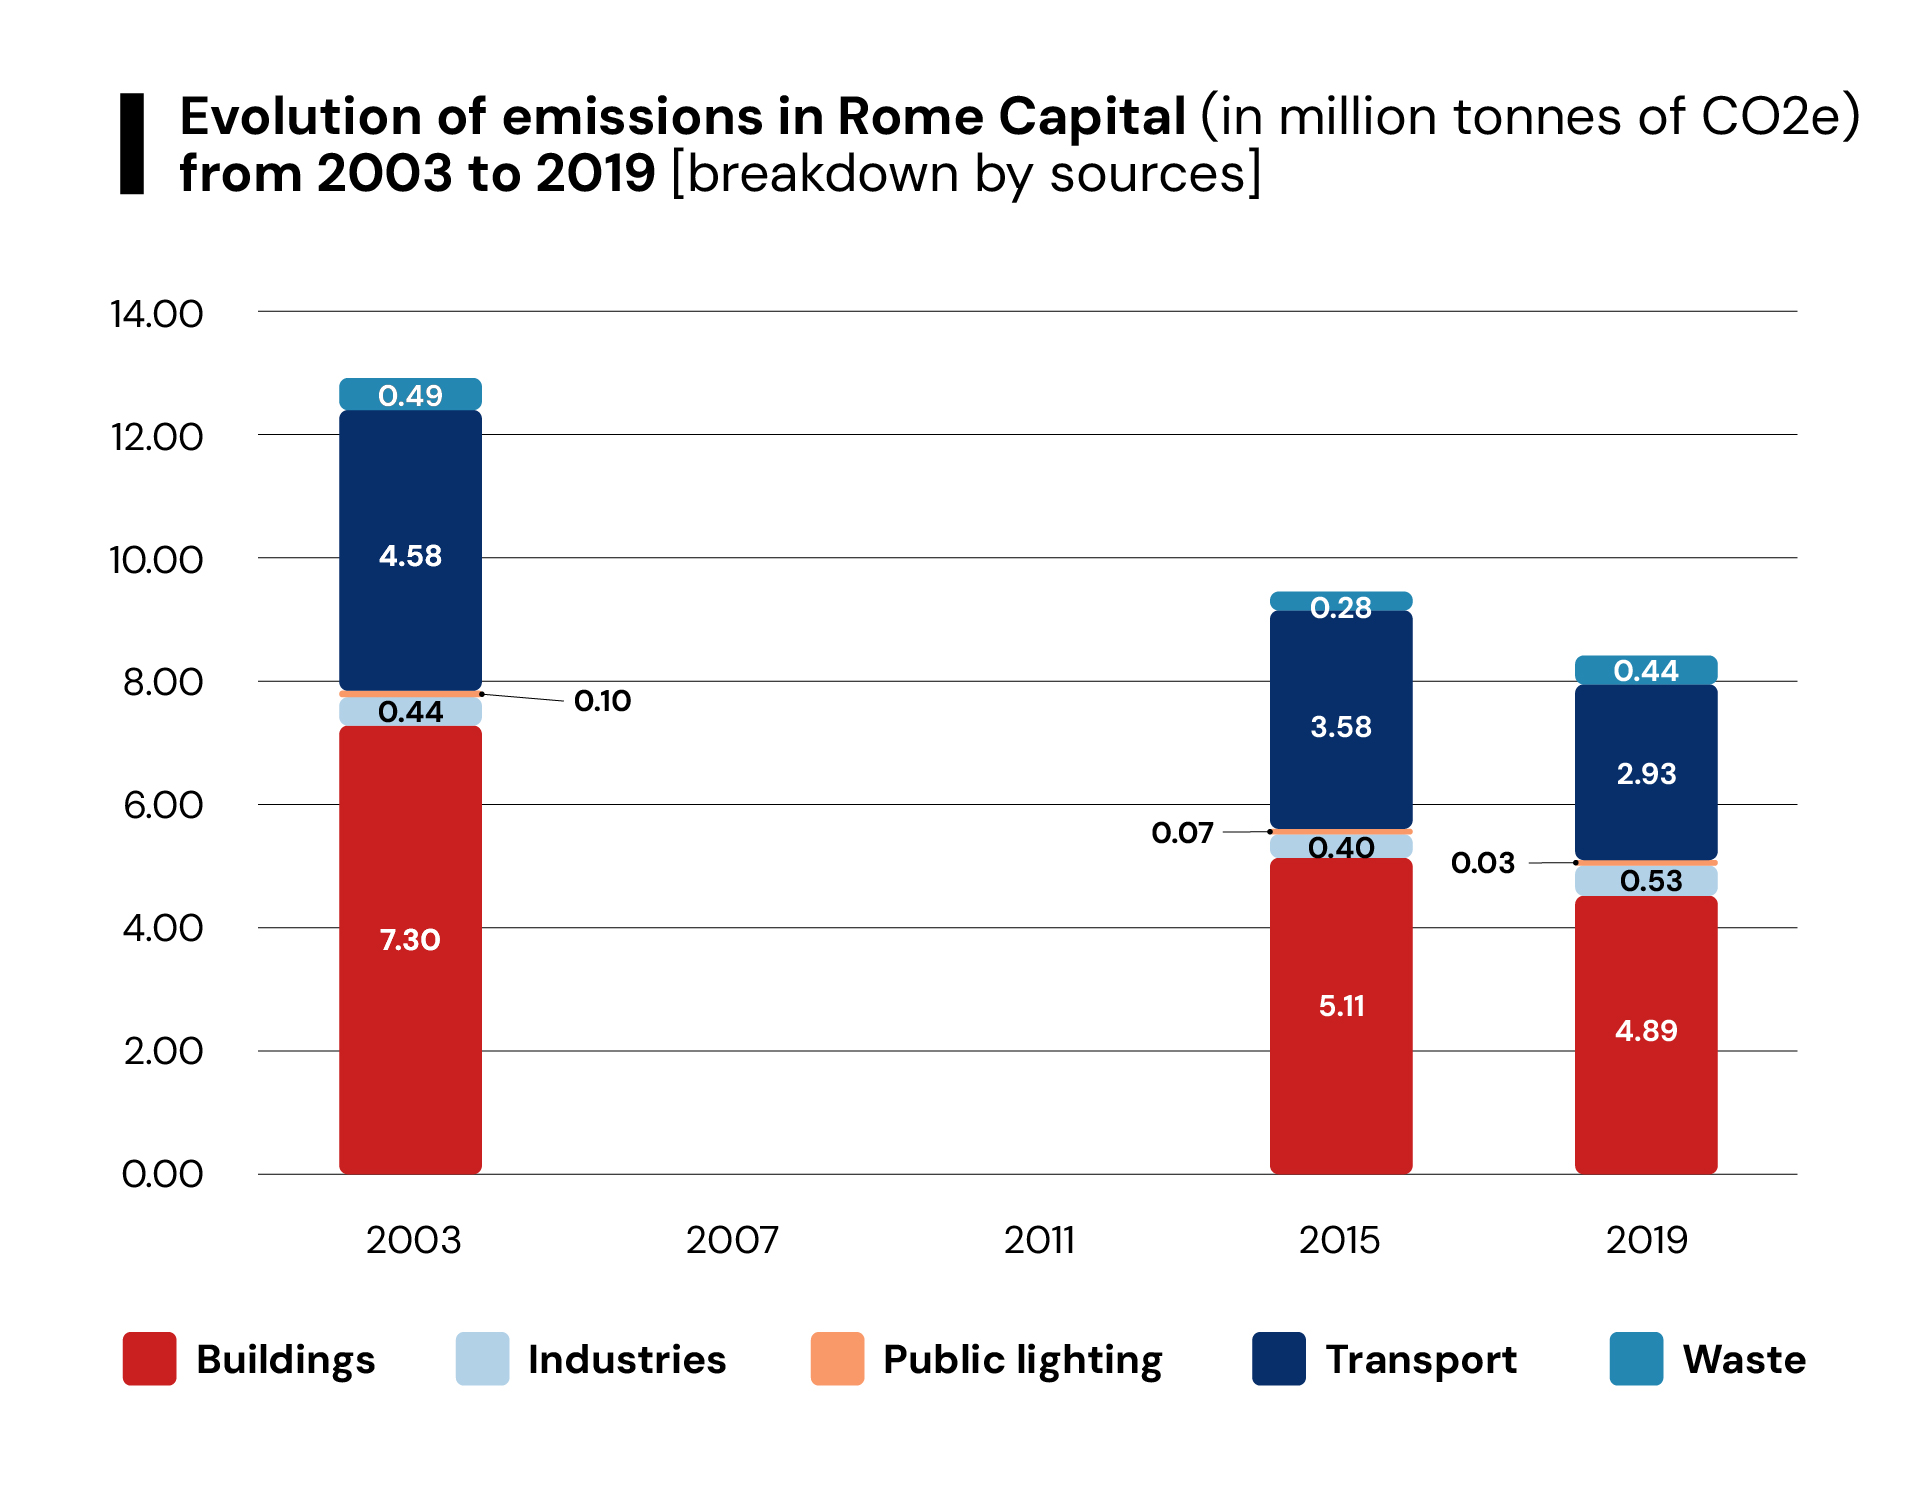
In Rome emissions are reducing. The analyses, carried out within the pathway of the drafting of the Climate Plan, show the steady decline since the beginning of the new century, with a 35% reduction since 2003 and 11% reduction since 2015, from 12.905 million in 2003 to 8.411 million tons of C02eq in2 2019. 2019 was taken as the base year for analysis and assessment because it is the last one before the pandemic. The per capita emissions are 2.9 tons CO 2eq in 2019, while they were 4.9 tons CO2eq in 2003. In all sectors there has been a gradual reduction in emissions in recent years, with the percentage distribution among sources remaining essentially constant over the years, and with about 94 percent of emissions related to building and transportation consumption.
The reduction in emissions that has taken place in recent years is mainly explained by improvements in technological efficiency. In particular, the renewal of the vehicle fleet (with less polluting cars and vehicles) has led to greater efficiency in combustion processes, while in building heating, the gradual replacement of the most polluting boilers with more technologically advanced systems and the thermal insulation and energy efficiency interventions in the building stock have reduced emissions. On the other hand, the growth in the energy mix of renewable sources has produced effects on the reduction of emission factors related to electricity consumption. In addition, the conversion of a large part of the lighting with LED lamps has enabled a reduction in emissions from public lighting.
Per fornire le migliori esperienze, utilizziamo tecnologie come i cookie per memorizzare e/o accedere alle informazioni del dispositivo. Questo sito utilizza cookie tecnici e di statistiche (anonimizzate). Non acconsentire o ritirare il consenso può influire negativamente su alcune caratteristiche e funzioni.